This repository was created by Thu Pham and Max Smith to help Michael Lerner teach a class at Earlham to look at climate patterns for July 2014 – June 2015.
We encountered a few difficulties because many of the cities we were modeling were missing data. We ammended the parser to circumvent this problem.
We wrote the csvMERGER found in the CSVTools.py to avoid having to replace data by hand. The wundergroundVisualization can then be used to create the images from the csv files.
Some Updates
- Michael wanted us to check that the extrema were correct. Indeed the one he was initially concerned with(Richmond) was NOT correct. These we believe were errors because we did them by hand. We have since checked many of the records and they seem to be right after merging with the program. All the files have been remerged.
- Some of the cities, an error was being raised in the parser because Wunderground was giving contradictory information. For example, it would state that the yearly record low was, say, 50 degrees. Then to the right it would state that the all-time record low was 54. This freaked the parser out. With the final data, the process would be as follows: first the day’s info would be overwritten to zeros, then it would be replaced by a nearby city’s data(cities specified below).
- There is a pre-merged folder. This is the raw data from our parser. This means some of the data is missing because it is not there(the case where “actual” data was missing), but it should also be noted that some of this data is missing because it raised a flag in the parser (the case with the record issue). In here you can find the raw csv-files and the raw visualizations with the missing data. There is also the final folder
Observations, city by city.
Evanston(KPWK): this data was very spotty. See for yourself. We merged it with Chicago. Luckily they weren’t missing any of the same days.
NYC: This data was perfect
Muncie, IN: this had reasonable records, merged with Indianapolis
Indianapolis: perfect data
Lawrence, KS: Lots of data missing, original had lots of record highs and lows, merged with topeka
Princeton, NJ: perfect data
Chicago,IL: 3 days missing, not same as Evanston, merged with Evanston
Last Update: 10/23/15
Contact: Randy Olsen, Michael Lerner — lernemi@earlham.edu, Max Smith — mcsmith12@earlham.edu, Thu Pham — tpham15@earlham.edu
github: https://github.com/mcsmith12/Climate_Analysis.git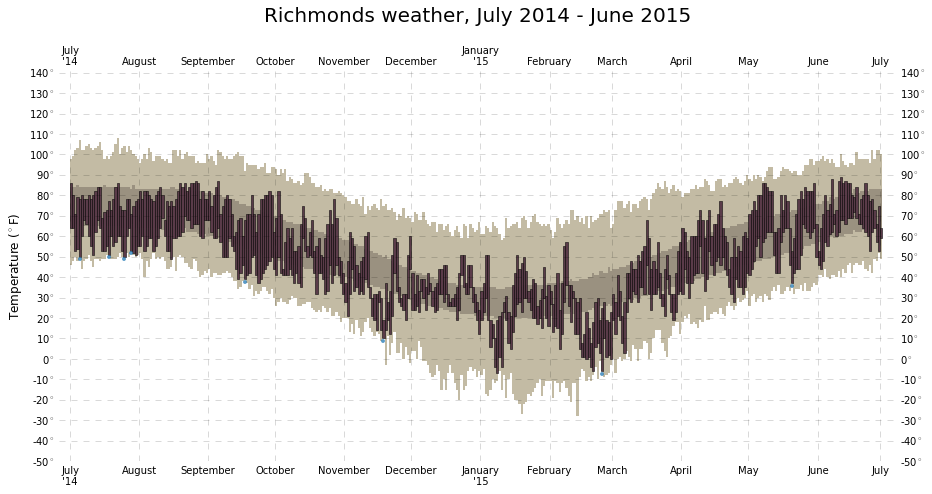


The code was adapted from Randy Olsen’s project found here
(http://www.randalolson.com/2015/08/13/the-new-york-times-weather-chart-redux/).