Introduction
The United States government keeps a large collection of data available to the public. One of these datasets is the census data. The census data is released every 10 years, while the American community survey (estimates based on a smaller sampling) is released every five years.
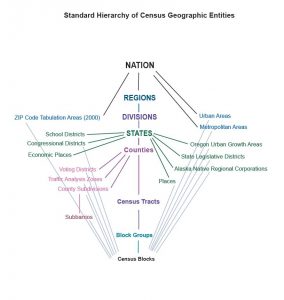
The census data is available at multiple levels: national, state, county, tract, block, block groups.
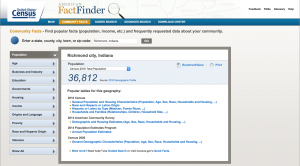
Many different types of information is available in the census data. The data is accessible through American FactFinder and is grouped into different categories.
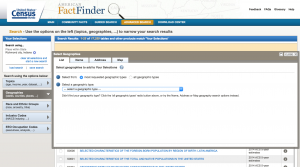
The best way to search for data is to use the Advanced Search tool at American FactFinder. Data can be filtered by topic or geography.
Mapping with QGIS
This tutorial will create a heat map of educational attainment in Indiana at the census tract level using the 2010-2014 ACS Survey Estimates.
QGIS is an open source mapping software that can be downloaded here.
The files used in this tutorial: CSV | Shapefiles
Step 1: Retrieving the data
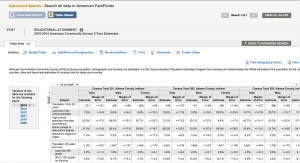
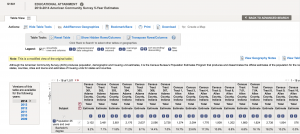
The search tool should show a table like above. Since we are only mapping one table, it will be best to modify this table first before downloading the data. Choosing ‘Modify Table’ will allow the data to be filtered.
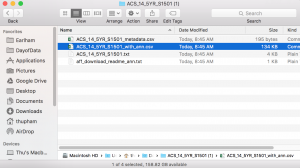
Choose ‘Download’ and use the preset options. Extract the zip file and use the csv file XXX_with_ann.csv
Step 2: Retrieving the Shapefiles
The shapefile is a popular vector format for storing the shape, location, and attributes of geographic features.
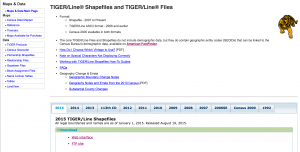
The United States keep a collection of shapefiles called TIGER/Line Shapefiles which correspond to the geographic divisions of the Census data. These shapefiles can be accessed here.
There are two ways to download the shapefiles. I have found that the Web Interface feature sometimes does not work.
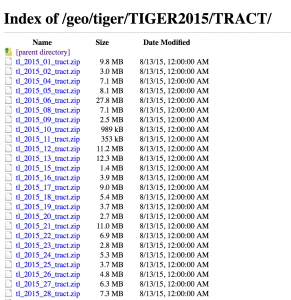
Navigate to the Tract subdirectory. The codes for different states can be found here. The code for Indiana is 18.
Step 3: Combining the data and Shapefiles (the actual mapping part!)
Step 3.1: Before combining the files, you need to create a csvt file in the same directory as your csv file with the types of data in your csv file. This will let QGIS do calculations on numerical data. You can make a csvt file by using a text editor and saving as a csvt.
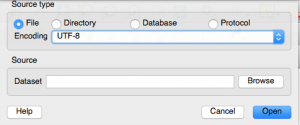
Open QGIS. In the top toolbar, go to Layer > Add Layer > Vector File and ‘Browse’. Find your .zip shapefiles. Make sure the econding is ‘UTF-8’
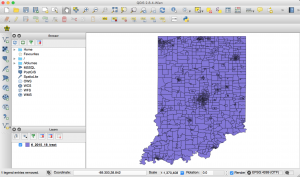
The shape file should appear.
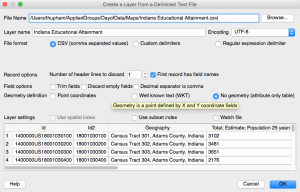
Now go to Layer > Add Layer > Layer from Delimited File. Make sure you select ‘No geometry (attributes only table)’
Your window should now have two new items in the Layers section in the bottom right corner. We will now join the shapefiles and the data.
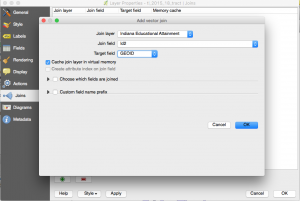
Double click on the Tract layer. Go to the ‘Joins’ tab. Press the green plus button at the bottom of the window. We will be joining the data and the shapefiles through the same geoid in each file. In the csv file this is the field Id2 and in the shapefiles this is the field GEOID.
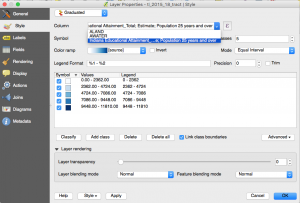
Now we will create the heat map. Go to the ‘Style’. Choose ‘Graduated’ from the pull down menu at the top of the window. Choose ‘Educational Attainment…25 years and older’ in the column and then press classify. You can choose either equal interval or Quantile (Equal Count) in Modes.
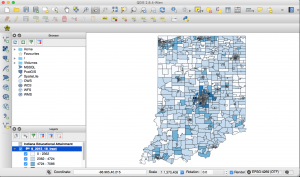
The map should now become a heat map.
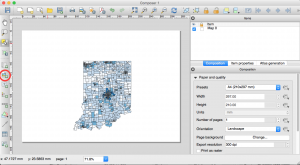
You can save the file as a jpeg by going to File > Print Composer. Add the map with the button encircled in red. Adjust the resolution as necessary and size of the image.

