Here are a few things Ahsan and I have been looking at throughout the E911 project so far.
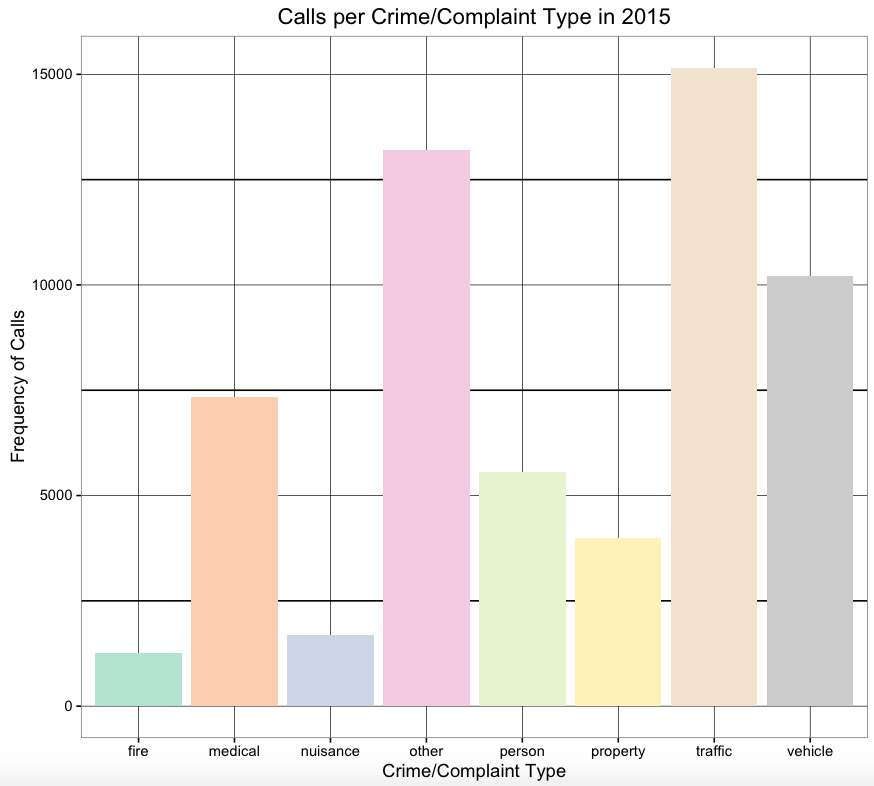
Ahsan and I grouped the calls into the groups above, this plots the frequency of each category of call.
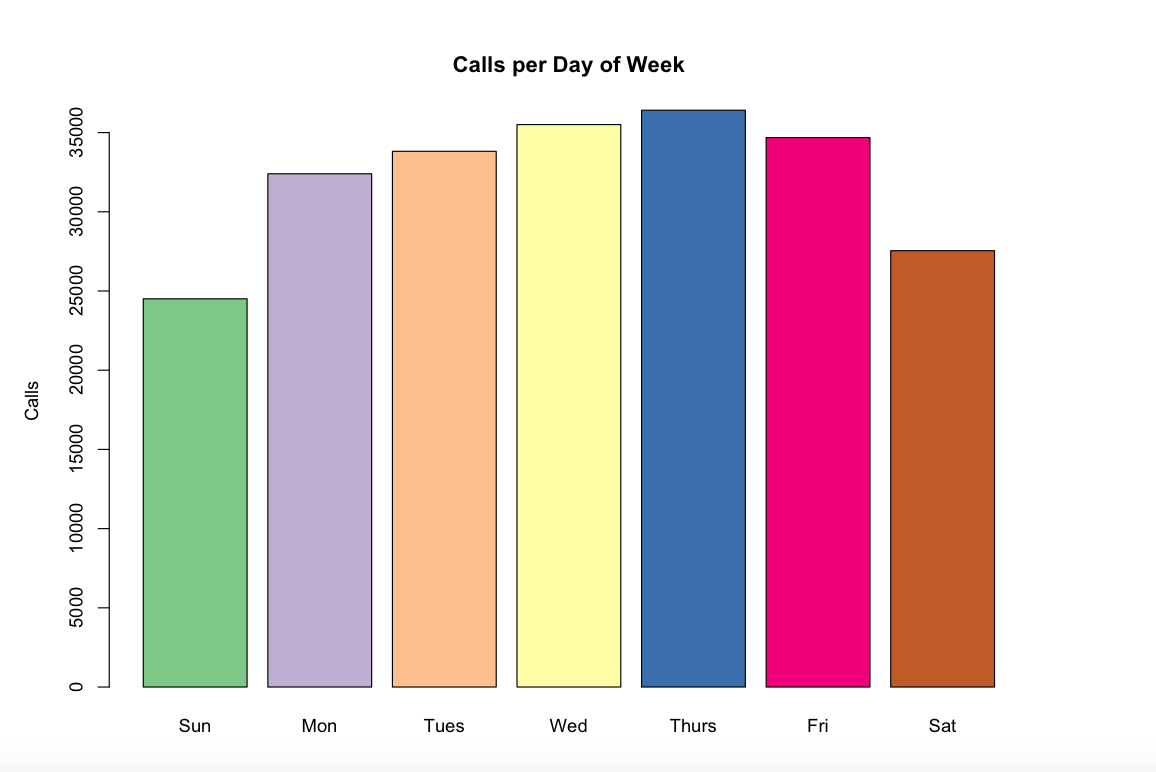
This graph displays the total number of calls made for each day of the week in the year 2015.
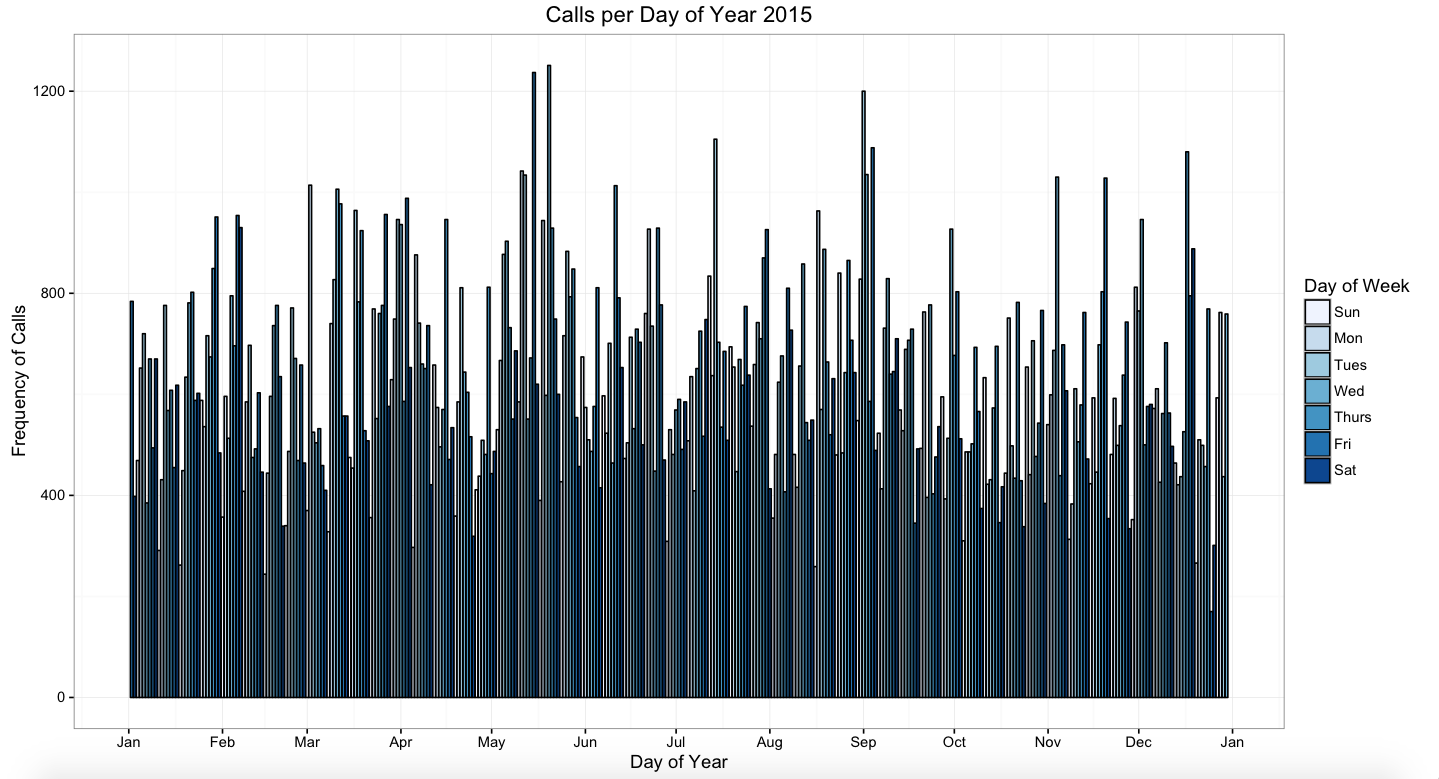
Here is a bar graph that plots the number of calls made every day of the entire year of 2015. The day of week is color coded to spot patterns. When looking closely, it is visible that the number of calls made on Sunday is generally less than other days of the week.