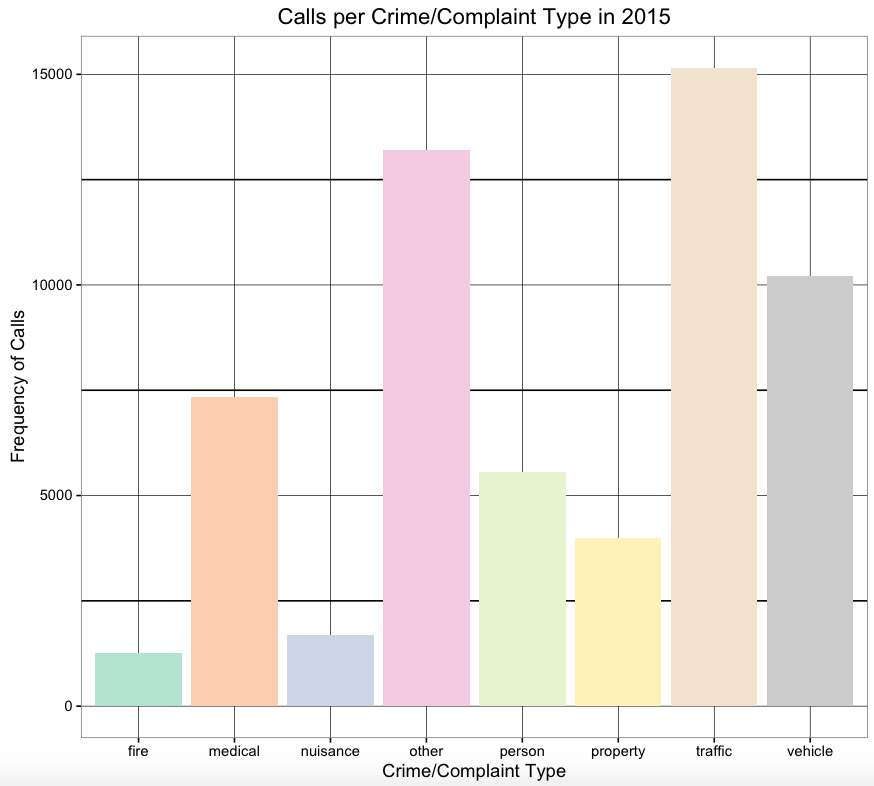
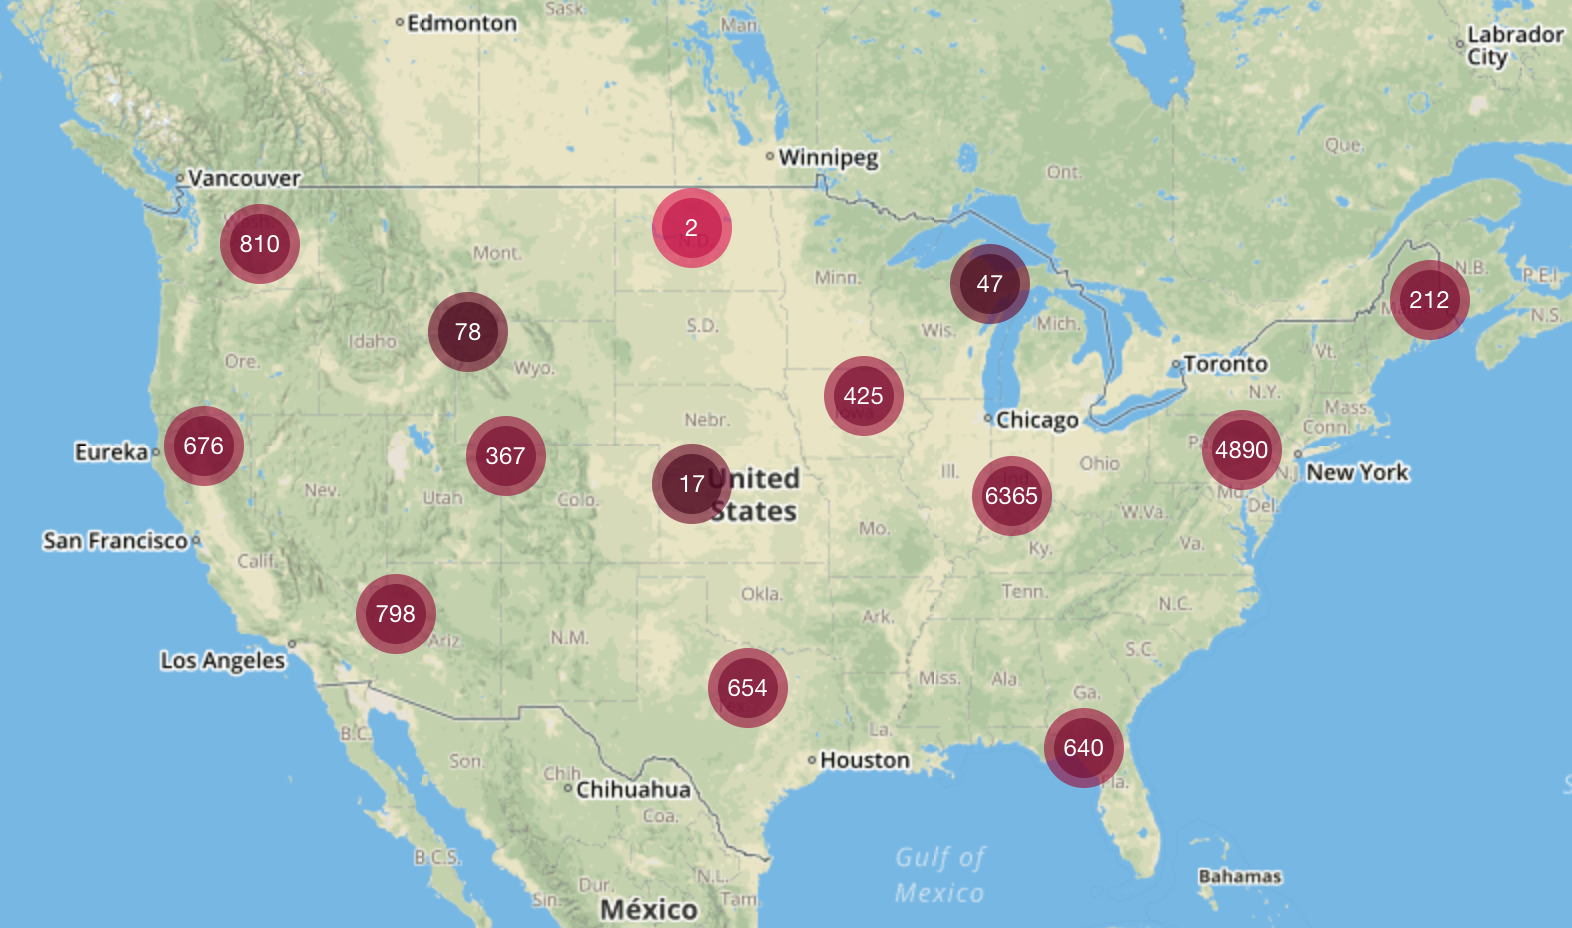
Plotting 911 Data Here are a few things Ahsan and I have been looking at throughout the E911 project…
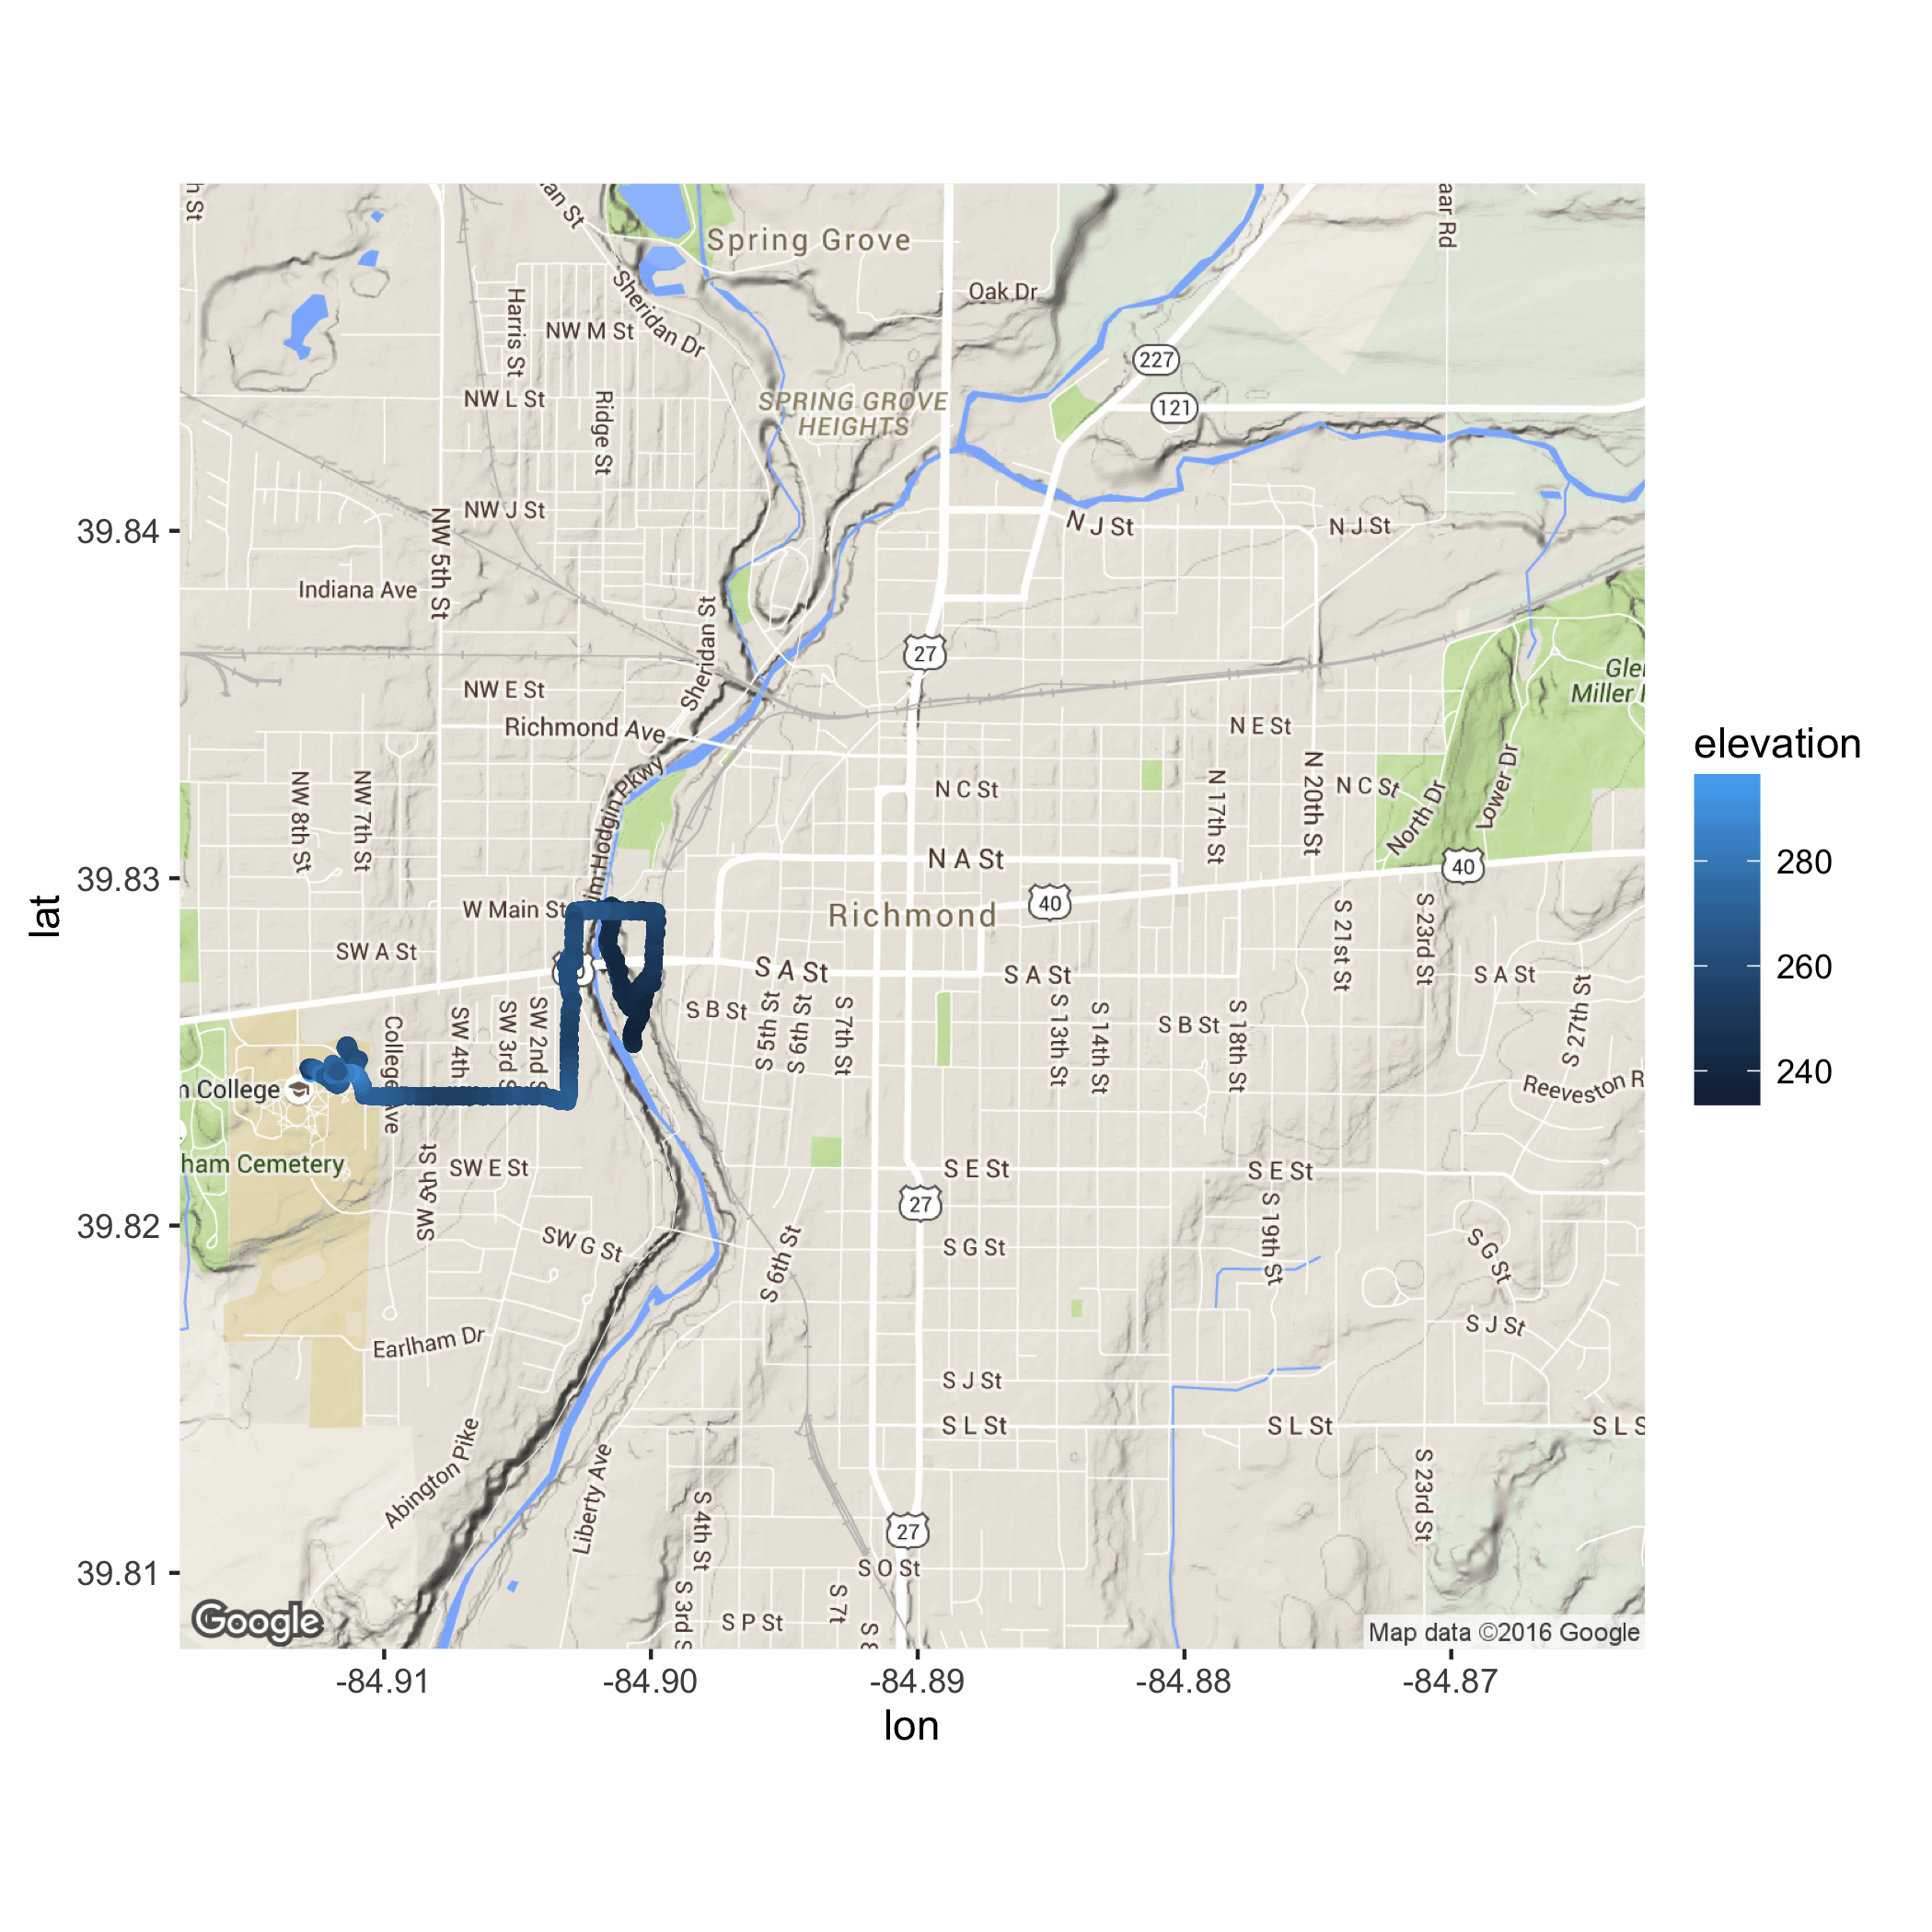
Quality Testing As part of my summer work I’ve been collaborating with the Field Science crowd, who are…
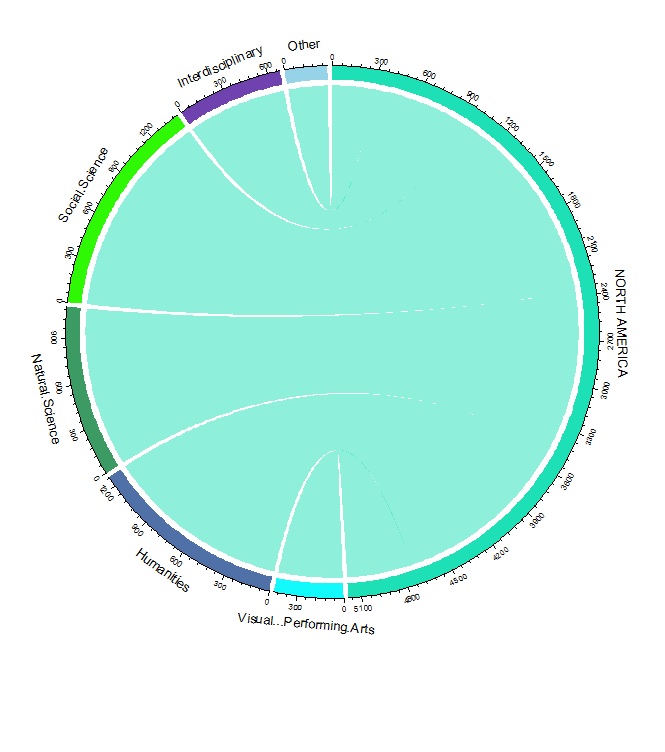
Majors Project – ChordDiagram Ahsan Ali Khoja & Shana Weissman We started this project with the question that whether the…
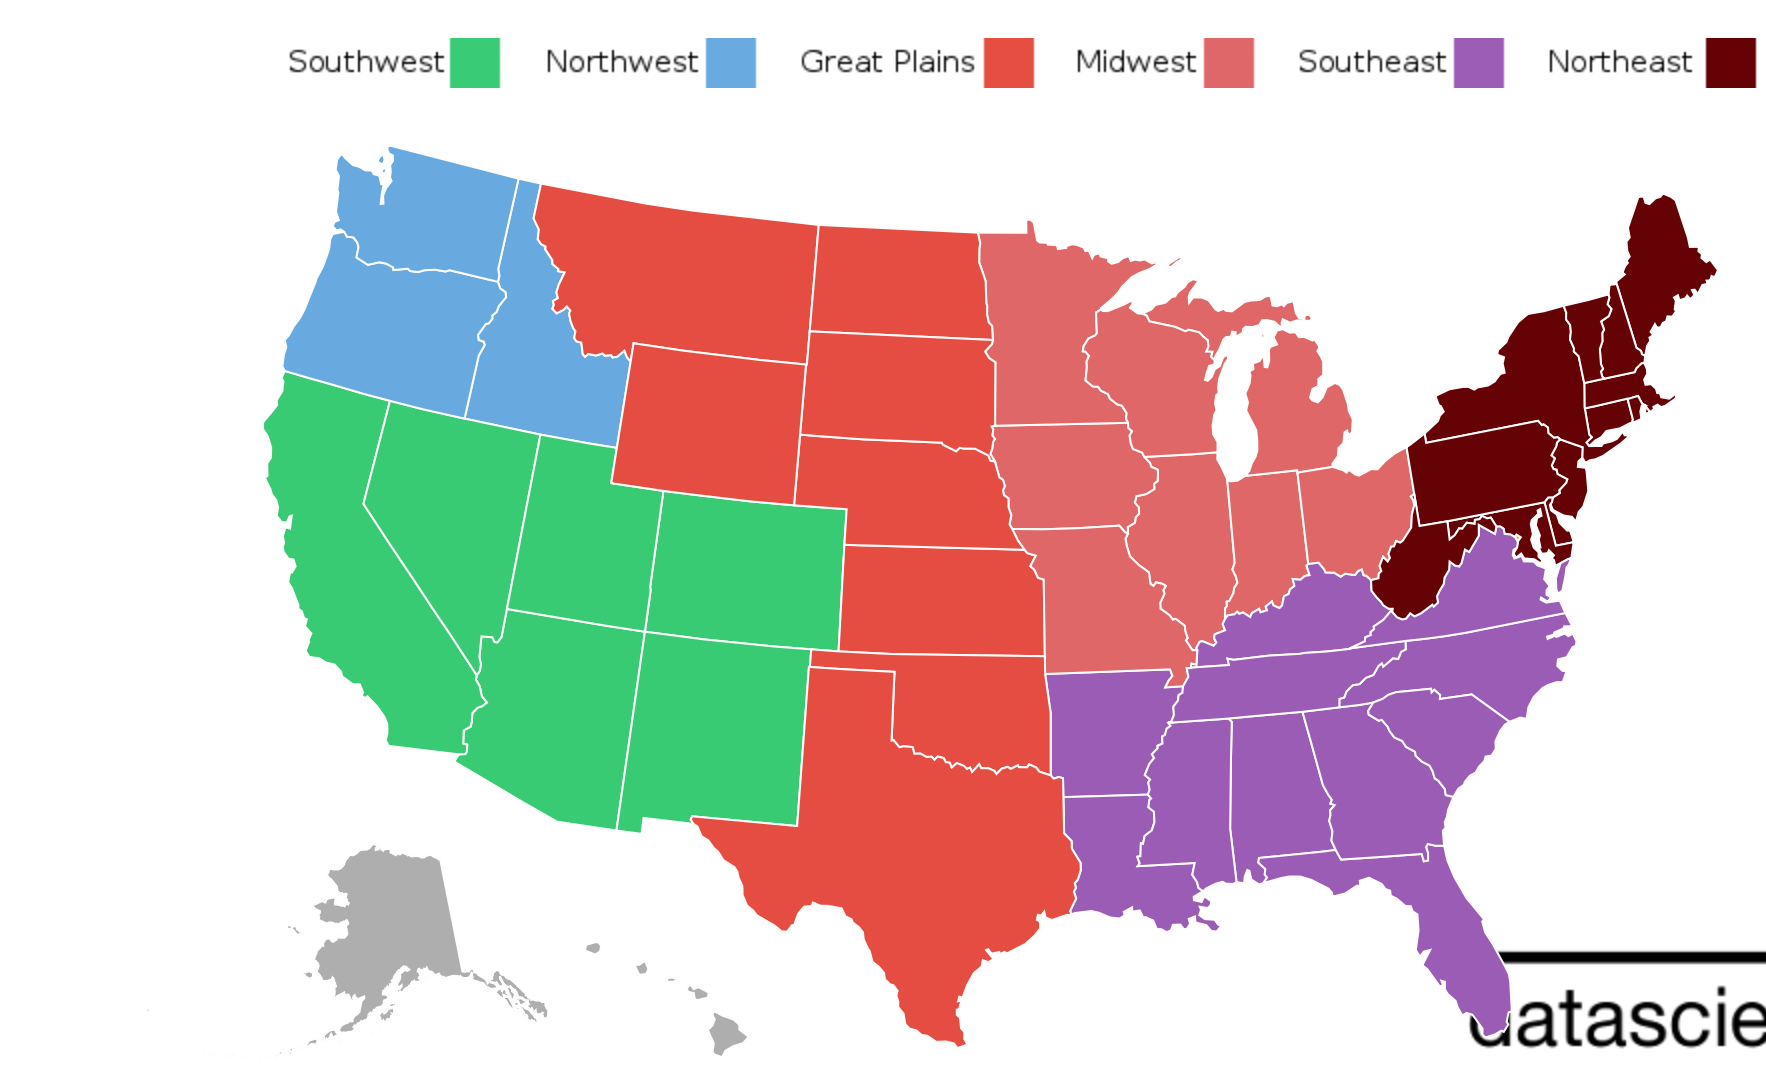
Mapping Earlham’s Alumni Earlham’s Alumni Development Office came to us with a problem, that we thought might be solvable…
Visualizing Climate Change This repository was created by Thu Pham and Max Smith to help Michael Lerner teach a class…